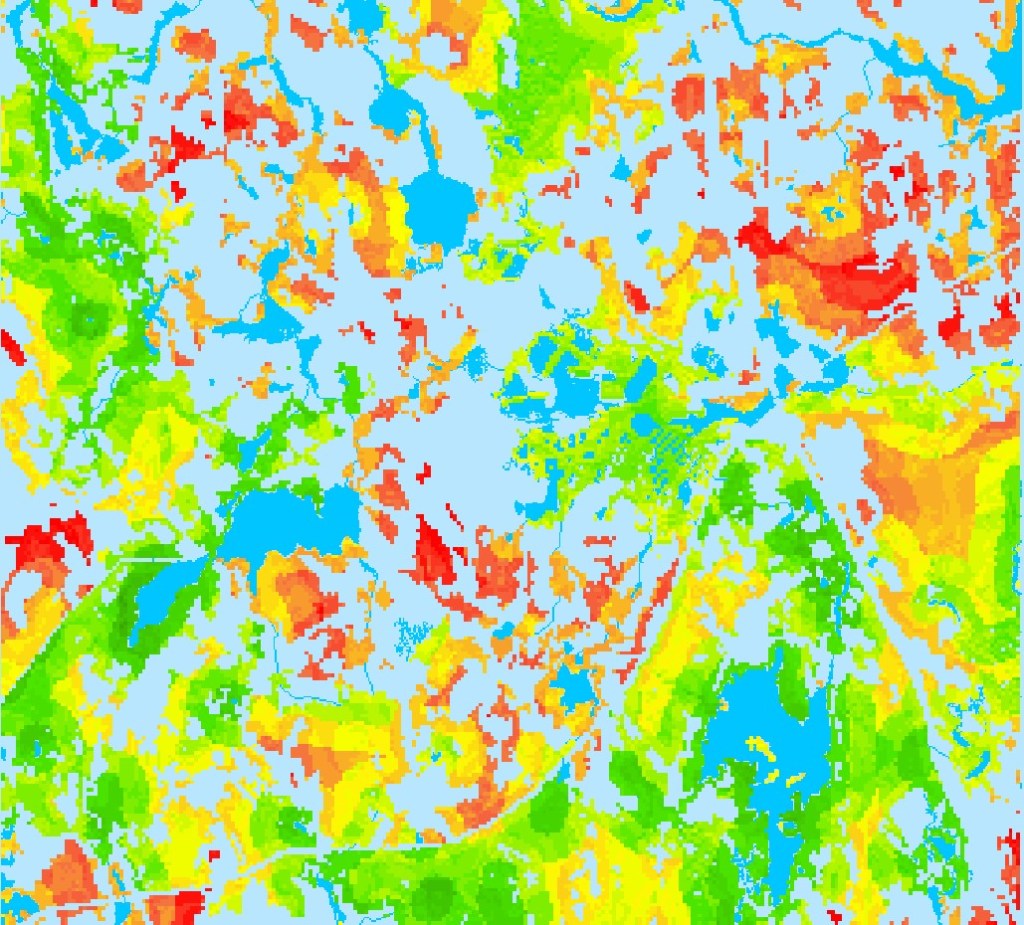
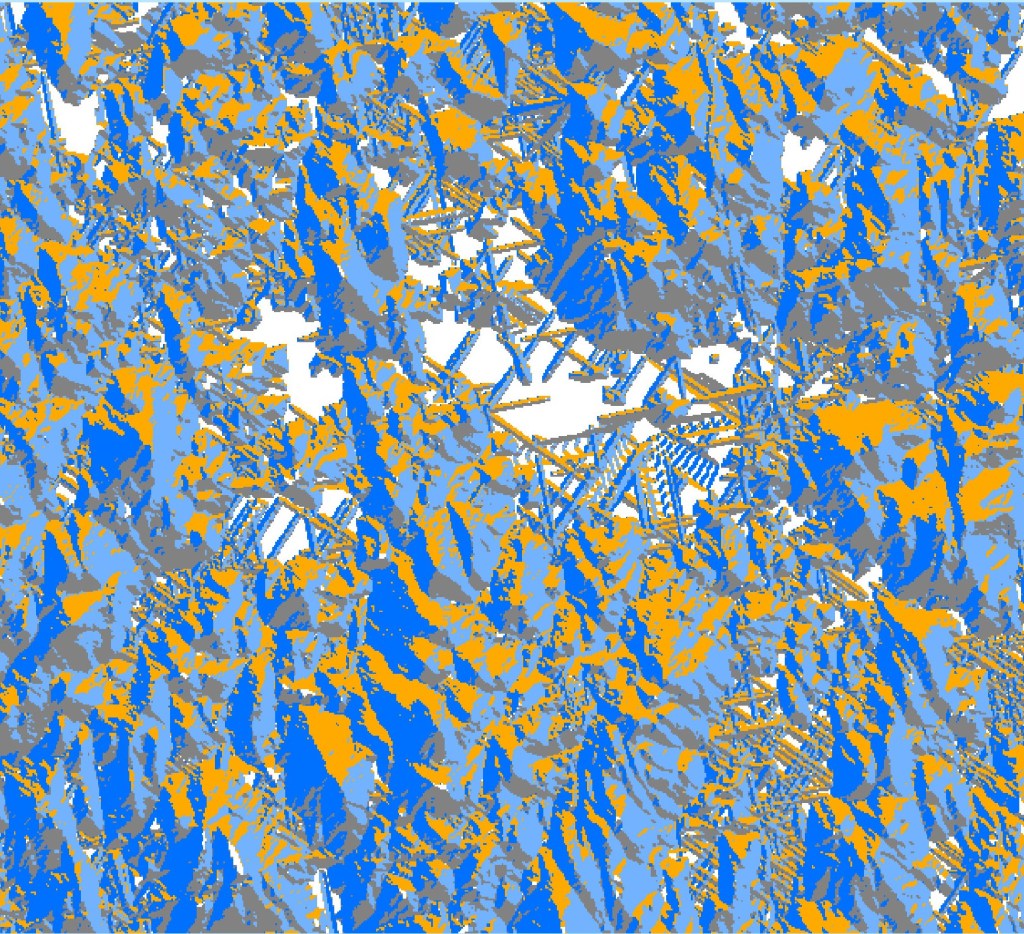
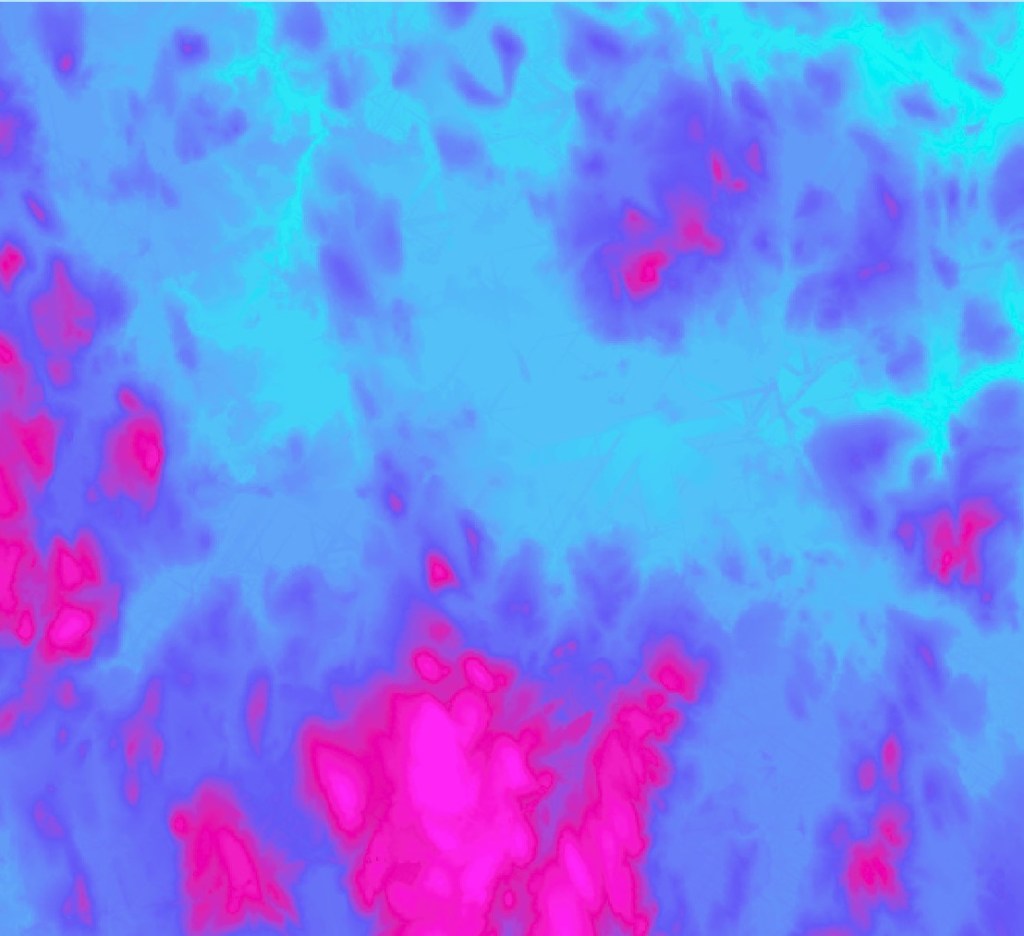
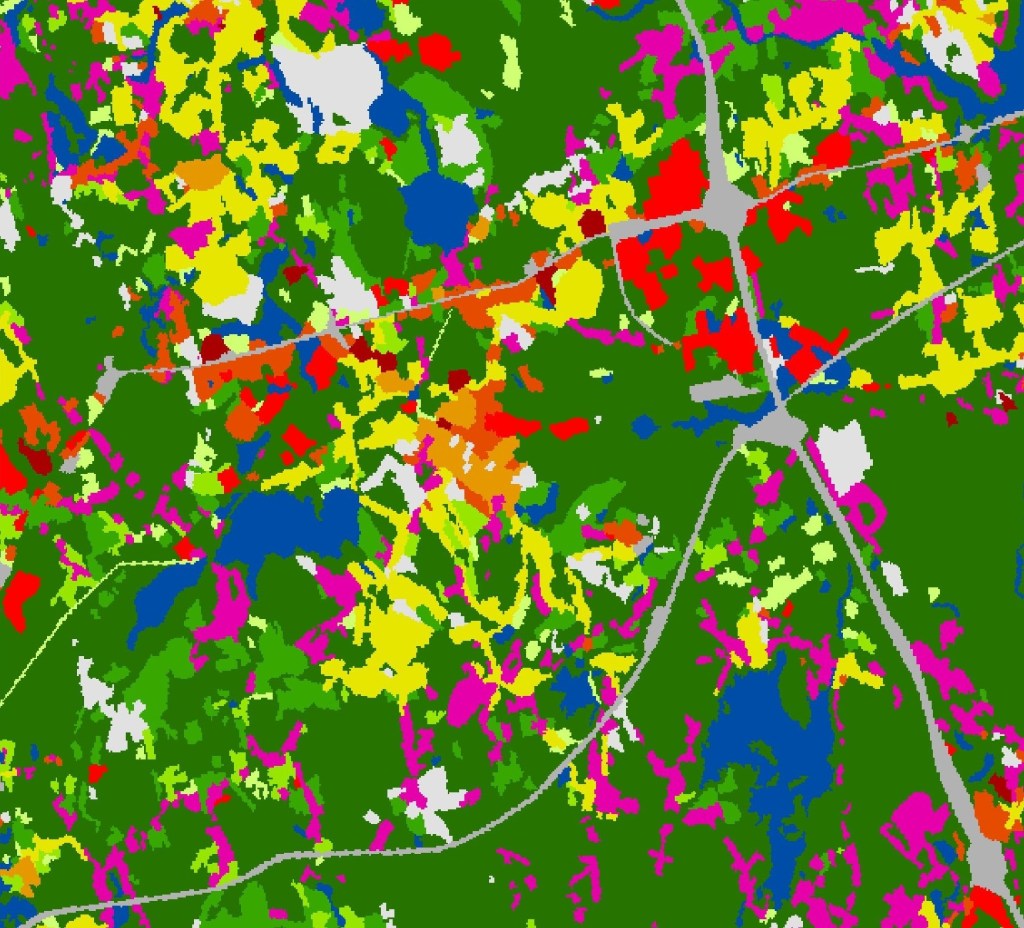
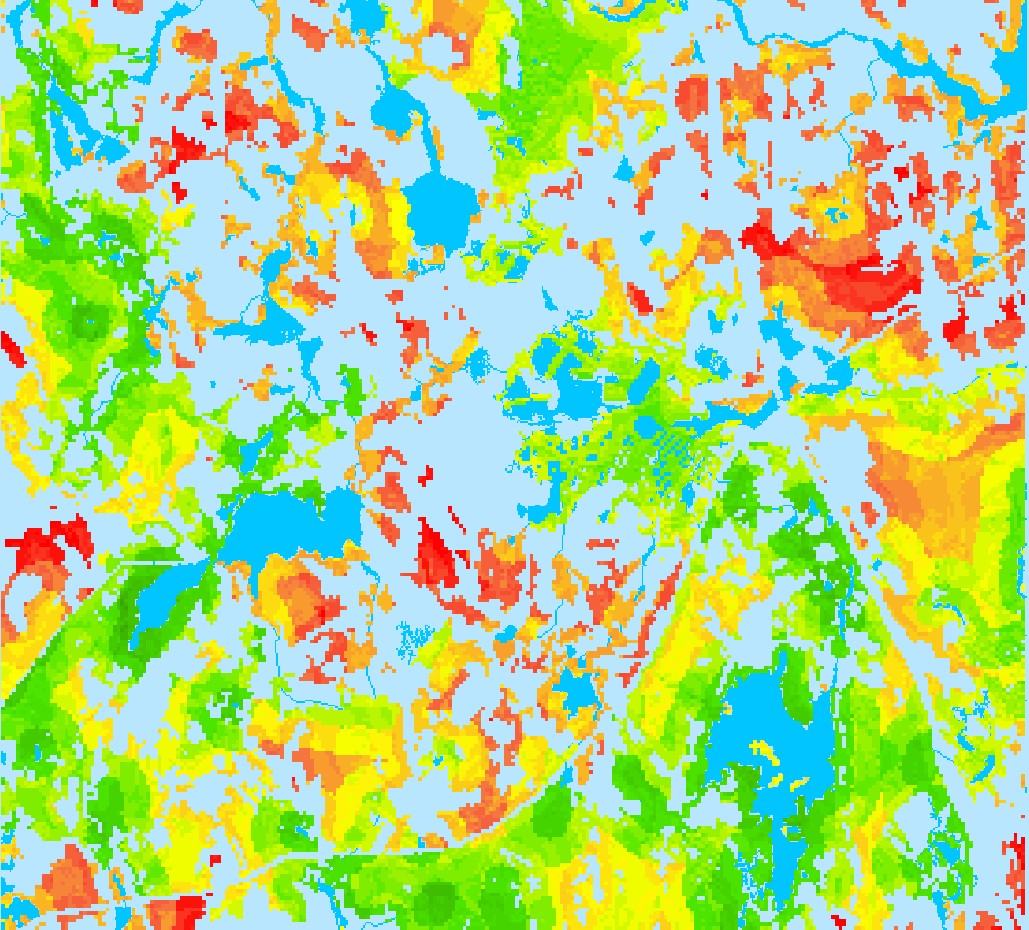
When choosing an area for environmental protection, many factors need to be considered. For this project, landuse data with digital elevation models (DEM) data and water features was used to analyze undeveloped and developed spaces, forestation, proximity to water, roads and buildings, slope and aspect to create a weighted model to identify the most suitable sites for environmental protection.
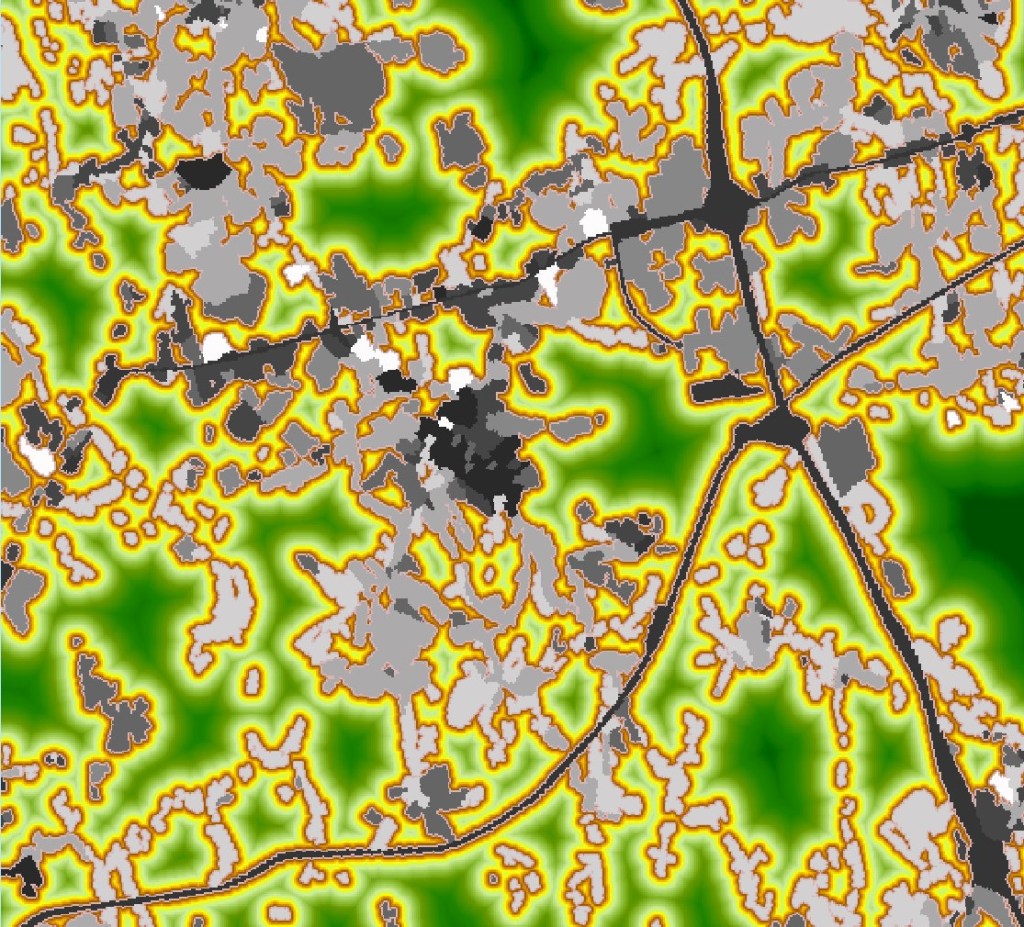
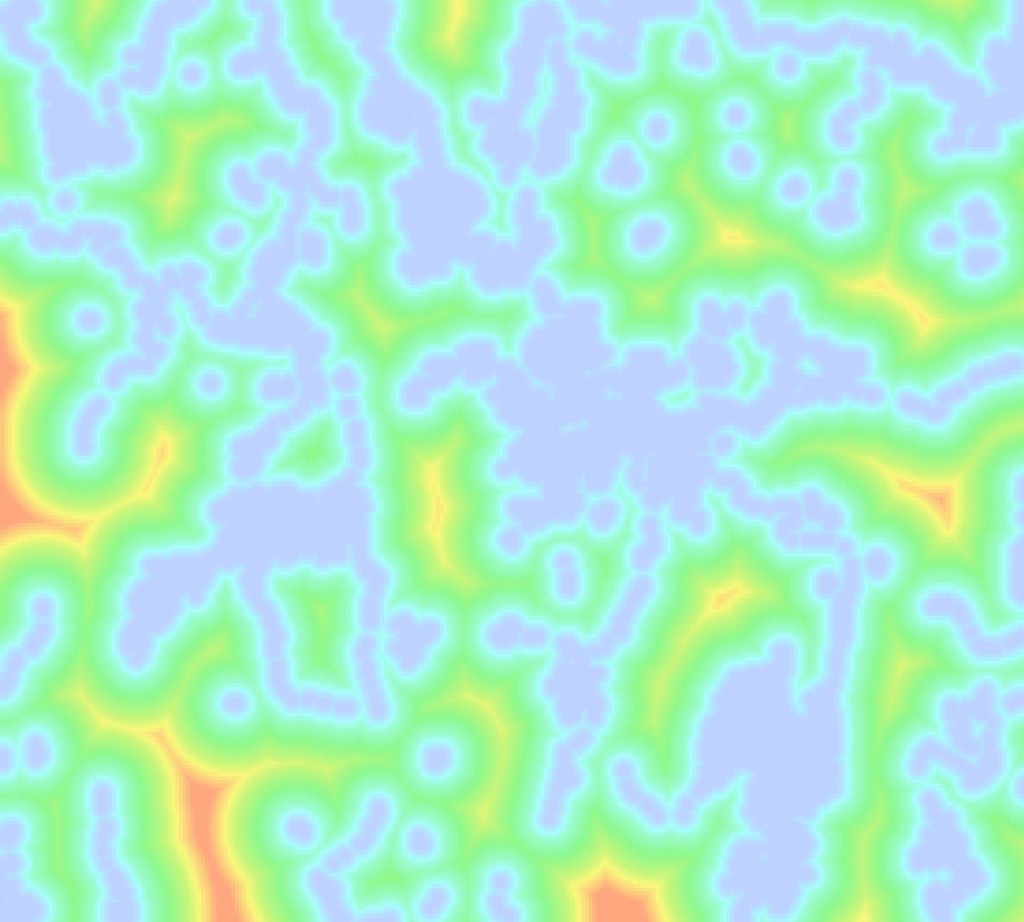
with Euclidean Distance
The Trouble with Boolean
One common method for using GIS to make decisions is to use Boolean Overlay, but Boolean has some limitations. First, Boolean returns a value of true, or “1” (when a criteria is met) or false, or “0” (when a criteria is not met). When analysis includes calculations, having a value of “0” in the data will predispose an area where a criteria is not met (false) to a situation where an area must meet all criteria to be considered suitable. This black-and-white thinking could lead erroneously to a conclusion that a site would be unsuitable, when in fact, it should be considered a strong candidate.
Secondly, when using a Boolean analysis, all factors are given equal importance. This could lead to an error when in fact, some factors should be given higher priority in determining suitability of a site. For instance, in this analysis, when considering the suitability of a site for environmental protection, it is more important to identify large patches of forest and water access as highly desirable, and proximity to developed land as something to avoid.
The Goal
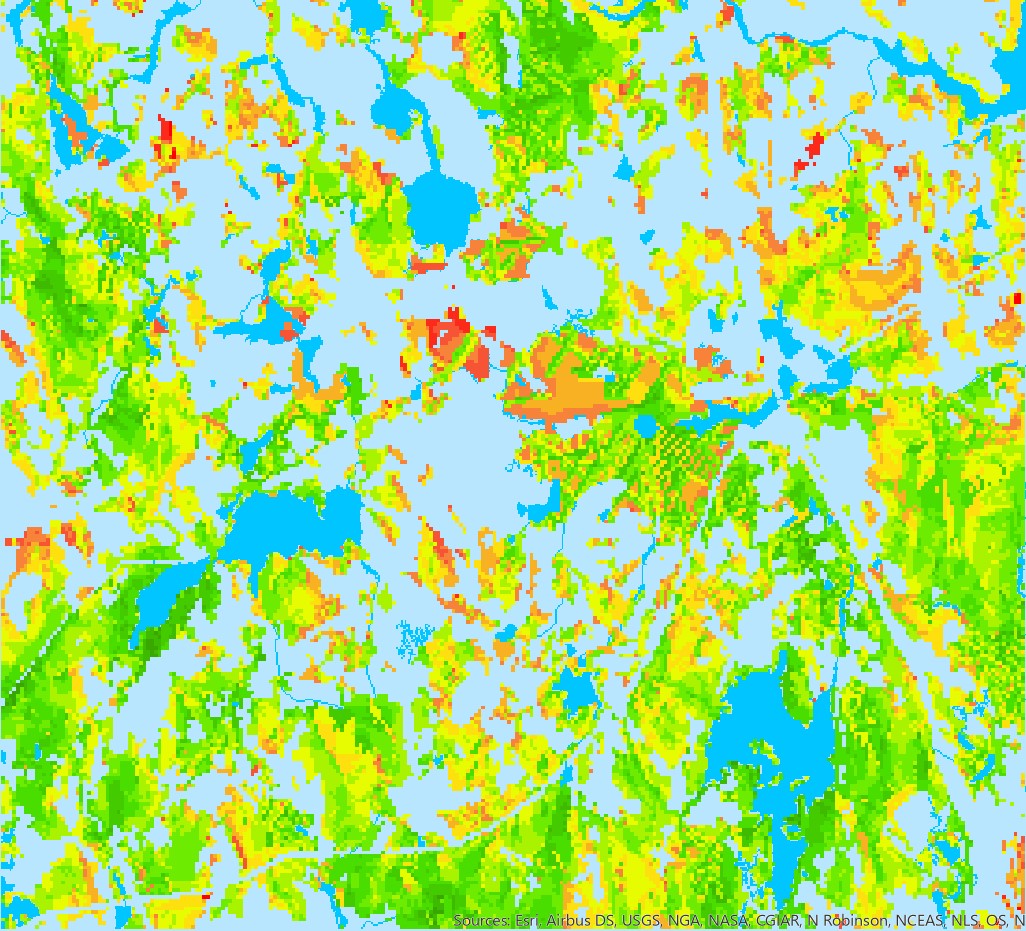
In order to preserve the information of which sites are suitable and why, the factors important to the analysis will be weighted, aggregated, and rescaled with a weighted linear combination (WLC).
The analysis described here was performed with three datasets: a Digital Elevation Model (DEM), landuse data, and water features data. This data was processed with geoprocessing tools and then reclassified before combining with weights using Weighted Sum.
Building a Model
To complete the Multi Criteria Analysis, I created a model that started with three inputs (landuse, DEM, and water features) and data for the three criteria were isolated. Lastly, I reclassified the data so that all types of data were comparable.
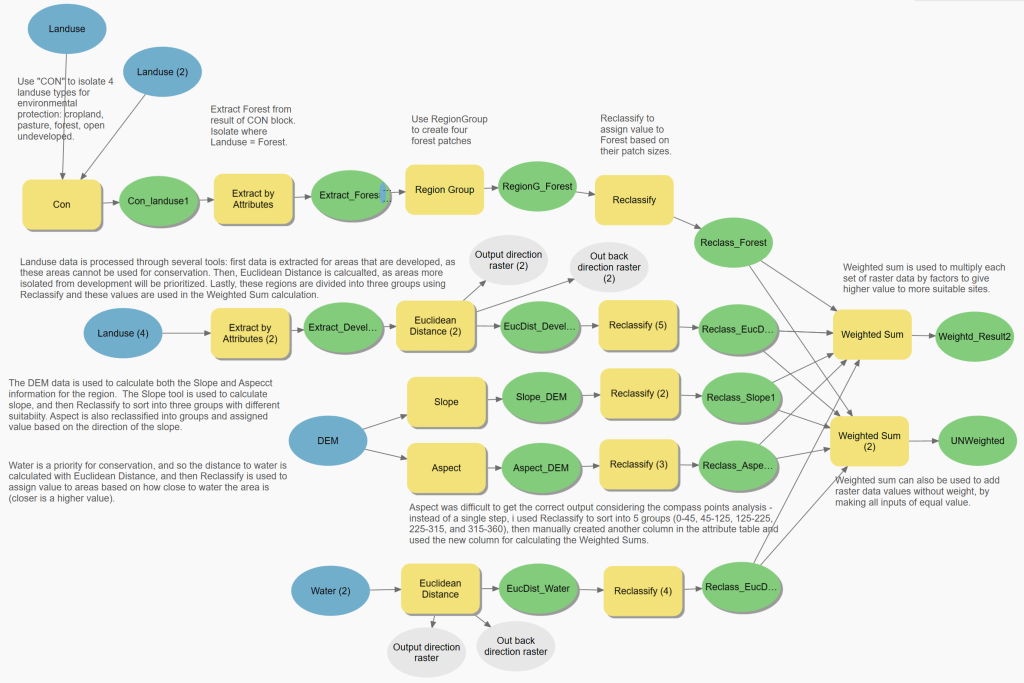
Why so much reclassification? When the data being input has different values and magnitudes, if you do not reclassify you have a situation where a factor that has large values (perhaps a distance) can overwhelm a factor with values of smaller magnitude (such as the number of adjacent patches of forest – the maximum here was four). In this model, reclassification resulted in each factor having regions of a value of one, two, or three (three was always the most desirable site for that factor, one was the least desirable site).

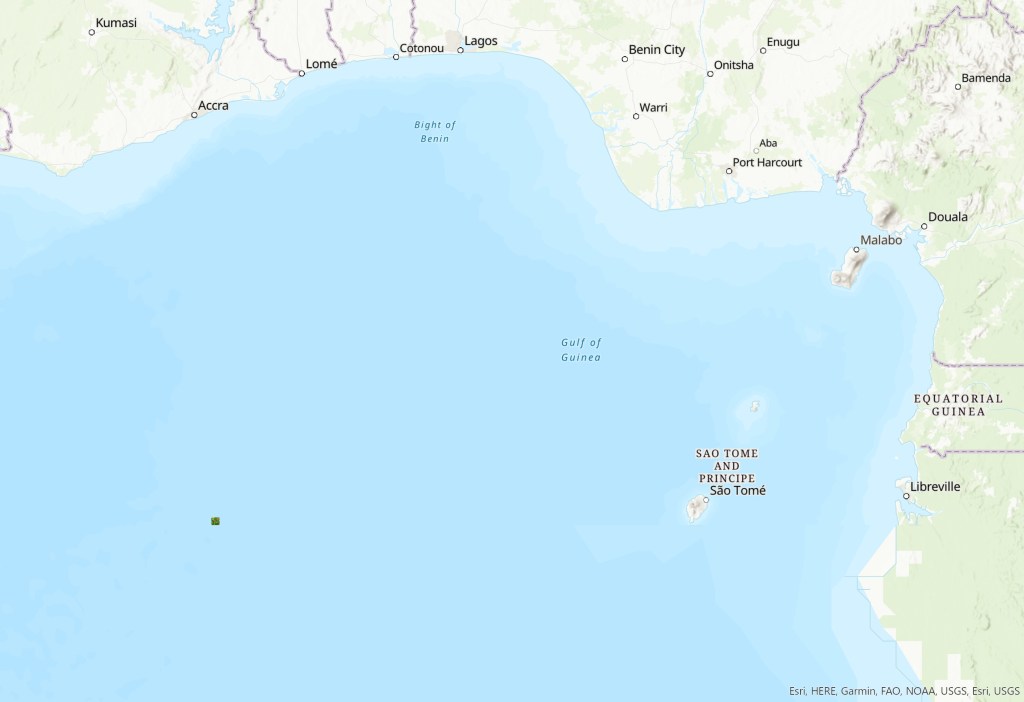
A Place Called Null Island
A little bit about Null Island.
O’Malley Maps is a portfolio of work created by Christina O’Malley
Don’t forget to follow me on:
Subscribe!
Subscribe to get updates about current projects!
Designed with WordPress.com
 Christina O'Malley, PhD